
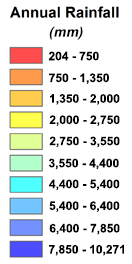
Seedling drought tolerance has been examined using an experimental approach under controlled greenhouse conditions on the University of Hawaiʻi at Mānoa campus for a diversity of native and non-native Hawaiian plants. Seedlings are grown from seeds collected in the field across the islands, and source populations are highlighted in the map above. For some species, multiple populations have been assessed, shedding light on intraspecific variation in seedling drought tolerance.
Tolerance is measured as growth (above- and below-ground biomass) and survival of drought-treated seedlings relative to seedlings in control conditions with ample water. Drought treatments include "press droughts" in which soil water availability is reduced by 20-50% and "pulse droughts" in which plants receive no water for a period of 2-5 weeks.
Drought tolerance index is calculated as the log response ratio (LRR) using biomass means, standard deviations, and sample sizes for the control and simulated drought groups within each species/population as: ln(MD/MC) where MD is the mean biomass of drought groups, and MC is the mean biomass of control groups, which is then back-transformed as: 100e(LRR) to produce the index as % total biomass of drought-stressed compared to control seedlings. A drought tolerance index of 100% indicates complete tolerance, resulting in similar biomass of drought-stressed and control seedlings. Indices less than 100% indicate incomplete tolerance, with increasingly low drought tolerance as the index approaches 0%. Drought tolerance indices based on mortality are calculated as % survival of drought-treated compared to control seedlings. Similarly, 100% indicates full drought tolerance via survival, and indices less than 100% indicate incomplete tolerance via mortality in drought conditions.
To obtain drought tolerance index information, select a species from the pull-down menu. For species with multiple populations tested, the results from all populations will be shown. You can also view all native and all non-native species to view the range of drought tolerance across species. Alternatively, you can select a site, from which seeds have been sourced for the experiments, to view the drought tolerance indices for species sampled at the various sites.